Product advantages
1.Compared with the second-generation single-cell transcriptome sequencing, the long read lengths of nanopore sequencing can obtain full-length transcript data at the single-cell level to achieve true full-length reads, especially when experimental samplesare difficult to obtain, such as in the case of specially processed cells or newly differentiated primitive cells in early stages of development. The full-length transcriptome can be obtained by nanopore single-cell full-length transcriptome sequencing to analyze transcriptome dataeven when the sample size is small. The obtained full-length transcripts can find many new transcripts missed by short-read sequencing, accurately perform variable splicing site analysis, and at the same time correlate these splicing events to its corresponding transcripts, discovering more isoforms. This unique advantage provides a strong guarantee for studying alternative splicing, gene fusion events, gene structure analysis, gene annotation and screening at the single-cell level.
2.Nanopore three-generation full-length transcriptome sequencing detects the expression of important single-cell genes that cannot be accurately measured with other methods due to cell heterogeneity. In samples such as tissue and blood, the cell composition in the sample may not be singular, or a certain type of dominant cell population may have higher gene expression. This masks the gene expression of a small number of cell populations. Conventional RNA mixed pool sequencing (Bulk sequencing) cannot accurately determine the gene expression level of a certain type of cell population.
3.Compared with the 10x single-cell marker &PacBio full-length transcriptome sequencingmethod, nanopore single-cell full-length transcriptome sequencing is less expensive. A PromethION chip can obtain up to 50M reads (internal sequencing data), more than the number of reads produced by PacBio.
Strategy
Please contact your regional technology consultant in advance.
Analysis

Results
Single Cell Transcript Structure Analysis
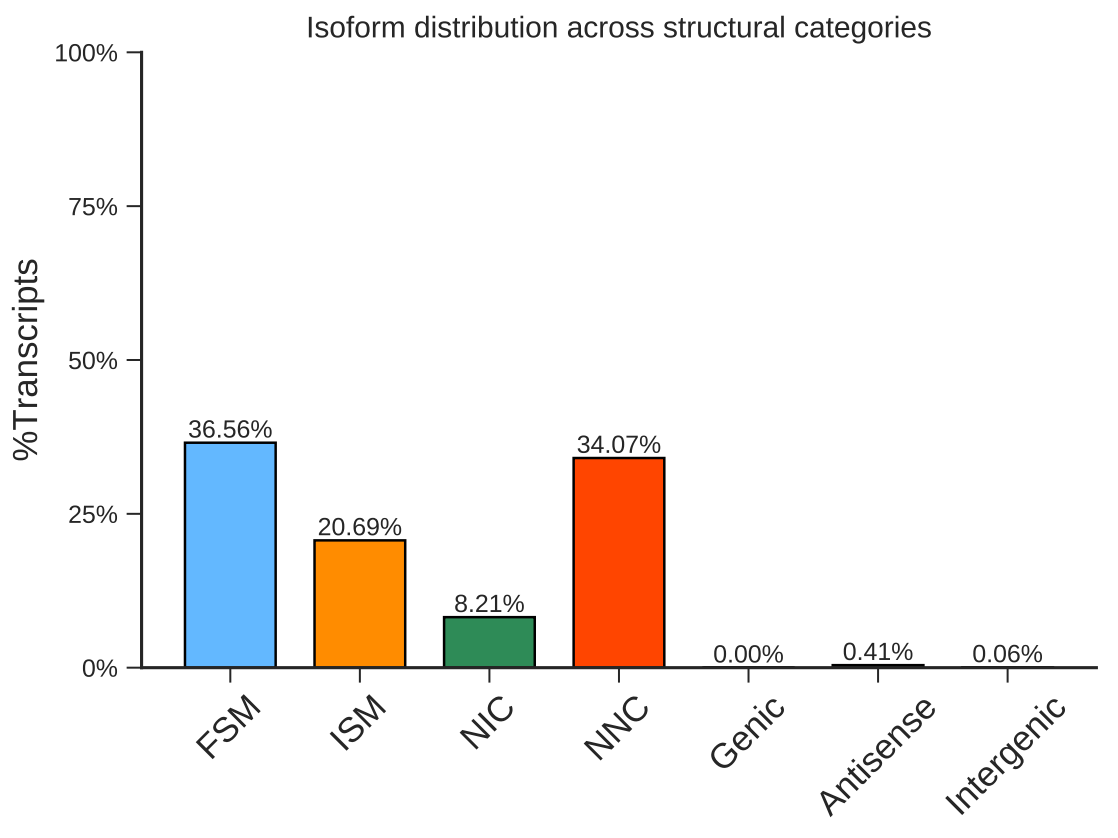
Single cell transcript alternative splicing detection

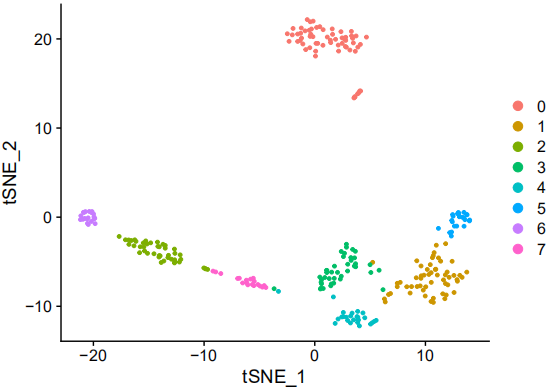
Cell clustering and characteristic gene screening
Common Questions
1.What is the difference between nanopore single-cell full-length transcriptome and the Smart-seq2 full-length transcriptome?
Answer: The main difference is the sequencing platform. The nanopore single-cell full-length transcriptome uses the Nanopore platform to achieve full-length transcriptome sequencing, while the Smart-seq2 full-length transcriptome uses the next-generation sequencing platform, which cannot achieve true full-length transcriptome sequencing.
2.The starting amount of cells is only 1-500, can it be more?
Answer: We will adopt the suggestion to develop full-length transcriptome sequencing for single-cell nanopores with large sample sizes.
Case Analysis
Case Analysis
Case Analysis
10x single-cell transcriptome combined with nanopore full-length transcriptome sequencing
This is a method that combines Nanopore sequencing technology with UMI and 10xGenomics single cell separation system to obtain error-corrected full-length sequence information. This method makes it possible to detect differential RNA splicing and RNA editing at the single-cell level.
This study designed a strategy that can efficiently and reliably allocate cellBC and UMI to Nanopore reads. First, use Illumina to perform short-read sequencing on the 10xGenomics library, define the relevant cellBC for each gene and genomic region, and then define the relevant UMIs combination for each cell, gene or genomic region. Then use the above information to guide cellBC and UMI to be allocated to Nanopore reads that have been aligned to the genome.
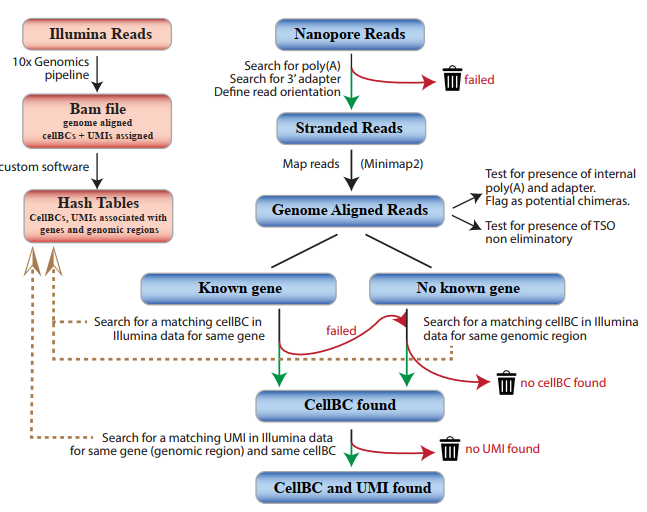
Figure 1 CellBC and UMI allocation strategy
The researchers used 10×Genomics to prepare 190 and 951 E18 mouse brain cell libraries, which were then sequenced using Illumina and Nanopore, respectively. The UMls molecular barcode minimizes the risk of the chimeric cDNA being incorrectly annotated as a new transcript. However, previous studies failed to use UMls in single-cell nanopore sequencing. In the UMI allocation strategy of this study, 97.4% of UMI was allocated to 76% of the Nanopore reads of the identified cellBC (Figure 2b, c). 75% and 82% of the UMIs and genes identified in single cells through next-generation sequencing are also found in the Nanopore data set, and the gene expression correlation between Nanopore and next-generation sequencing is excellent (Figure 2e -g). Therefore, the Nanopore data set specified by this strategy cellBC and UM1 is a good representative of the transcriptome captured in the 10xGenomics method.
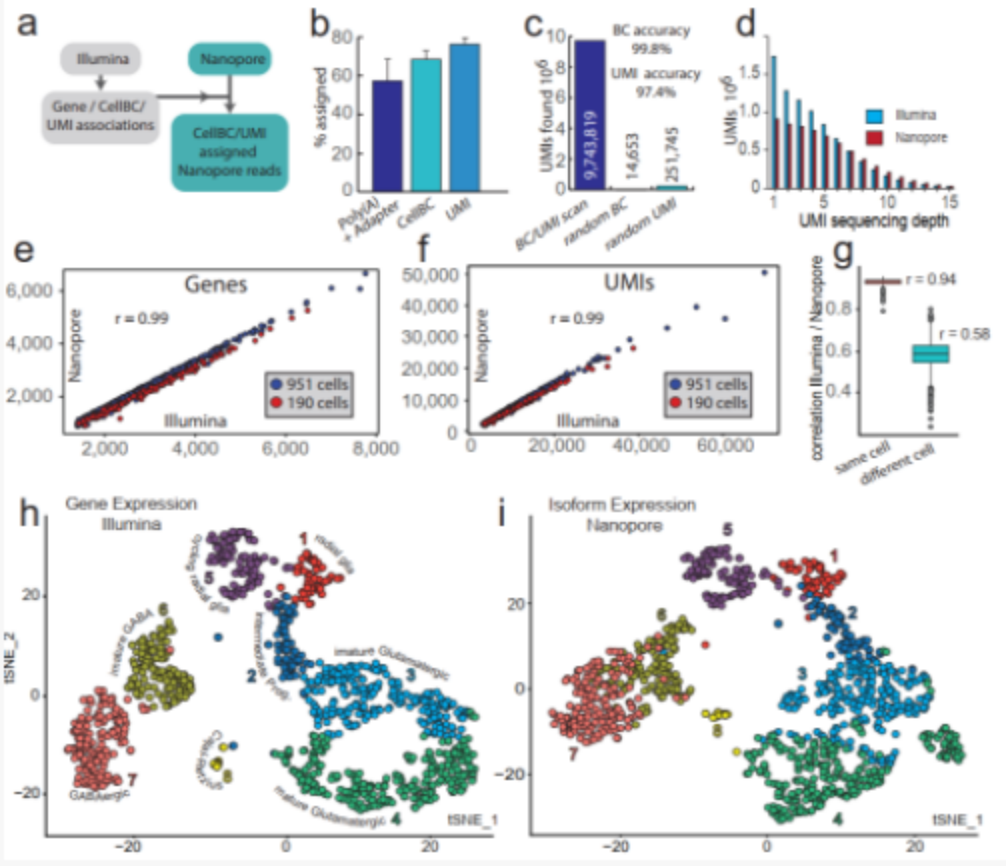
Figure 2 Nanopore single-cell transcriptome sequencing.
(a) Cell barcode and UMI allocation strategy; (b,c) Cell barcode and UMI allocation efficiency (b) and accuracy (c); (d) UMI sequencing depth of Illumina and Nanopore data sets; (e,f) passed Illumina and Nanopore sequencing to detect the number of genes (e) and the number of UMIs (f) in 1141 cells; (g) the correlation of gene expression between Illumina and Nanopore sequencing data; (h,i) Illumina gene expression (h) and Nanopore transcriptional isoform expression (i) t-SNE map.
The t-SNE images of typical cell types in E18 mouse brains determined by Nanopore and next-generation sequencing showed similar clusters (Figure 1 h, i). The researchers further searched for 139 genes with differential expression of transcriptional isoforms between clusters. For example, clathrin light chain A (Clta) undergoes significant isoform conversion during neuronal maturation (Figure 3 ad). The structure conversion may fine-tune the role of the protein in different developmental stages.
Researchers grouped the reads of the same UMI to correct Nanopore sequencing errors, generating a consistent sequence for each RNA molecule, and identifying this sequence heterogeneity in a single cell (Figure 3 e, f). The consensus sequence analysis after correction of Gria2 confirmed the previous findings about Gria2 editing, and revealed that the editing of one site increases the possibility of editing another site (Figure 3g). Therefore, single-cell long-read sequencing both confirms and expands the previous knowledge about Gria2 editing in the central nervous system.
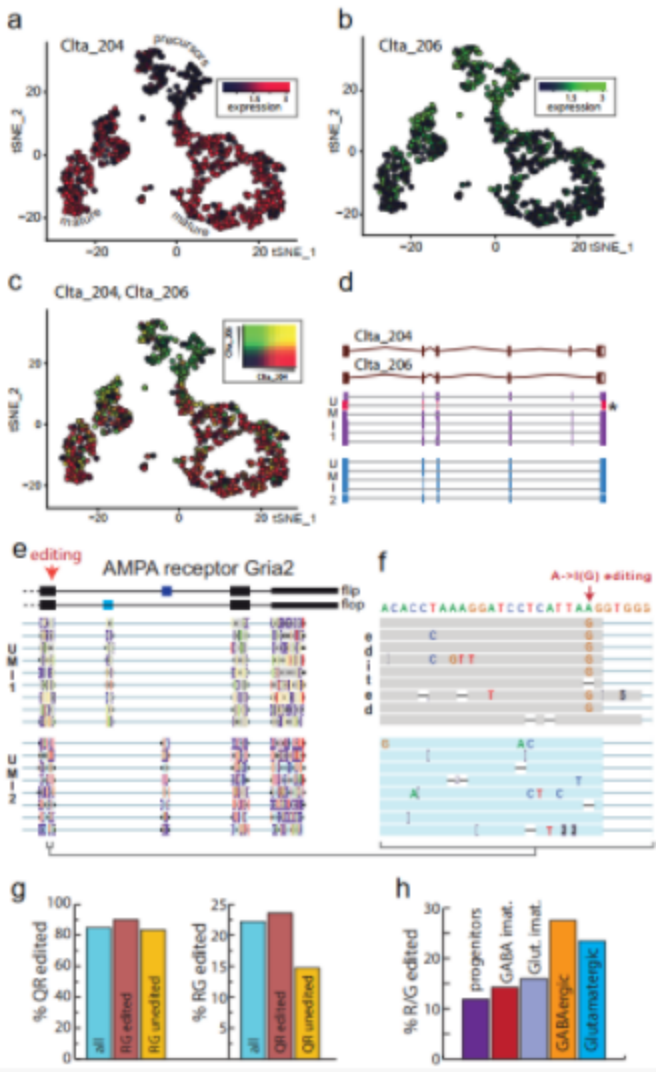
Figure 3 Nanopore single-cell transcriptome sequencing shows transcript diversity.
(ac) t-SNE diagram shows the Clta subtype expression switch during neuron maturation; (d) the main Clta splice variants of the two UMIs and the supporting genome alignment read; (e) the main splice variant of Gria2 ; (F) R/G A->I editing site amplification; (g) Q/R and R/G editing; (h) During neuron maturation, R/G site A->I editing expansion will be increased.
References: Lebrigand K, Magnone V, Barbry P, et al. High throughput, error corrected Nanopore single cell transcriptome sequencing[J]. bioRxiv, 2019: 831495.


