Strategy
Sample requirements: conventional animal and plant samples, total sample DNA ≥10 μg, sample concentration ≥100 ng/μl
Sequencing method: non-PCR amplification library construction, Nanopore sequencing
Recommended sequencing volume: no less than 30X data
Analysis
- Reference sequence alignment analysis
- Detection of different types of base modification sites
- Base modification degree analysis
- Context motif analysis of base modification sites
- Functional analysis of base modification genes
Results
1.Detection of different types of base modification sites
Through software comparison, methylation site analysis is performed to obtain reliable methylation modification information from the sample.
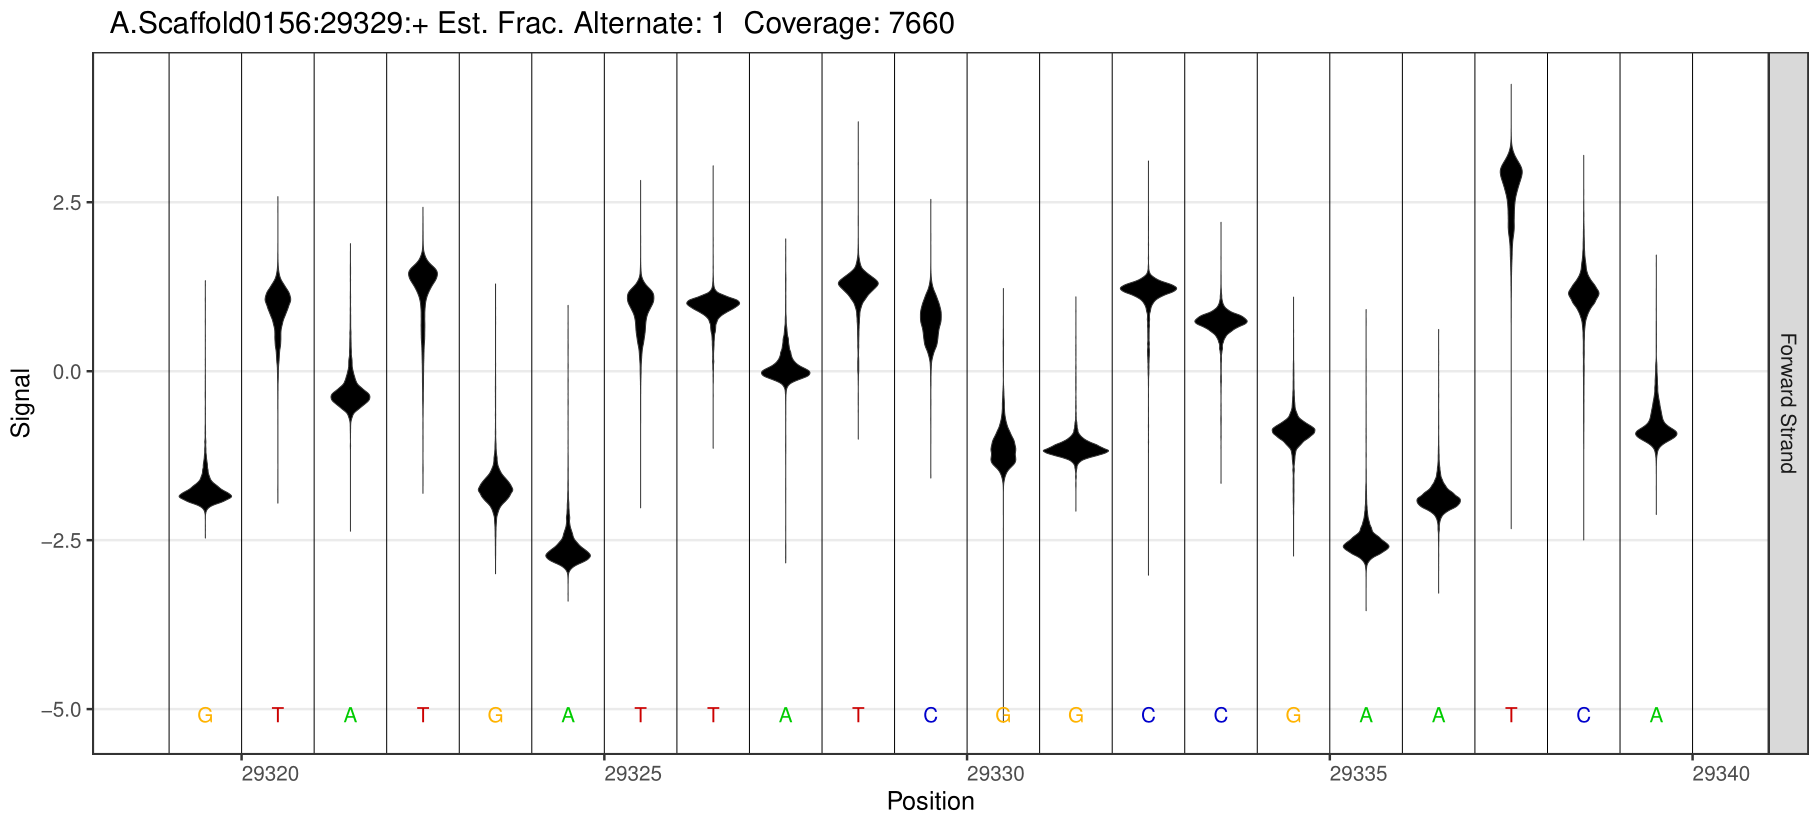
5mC Site Detection
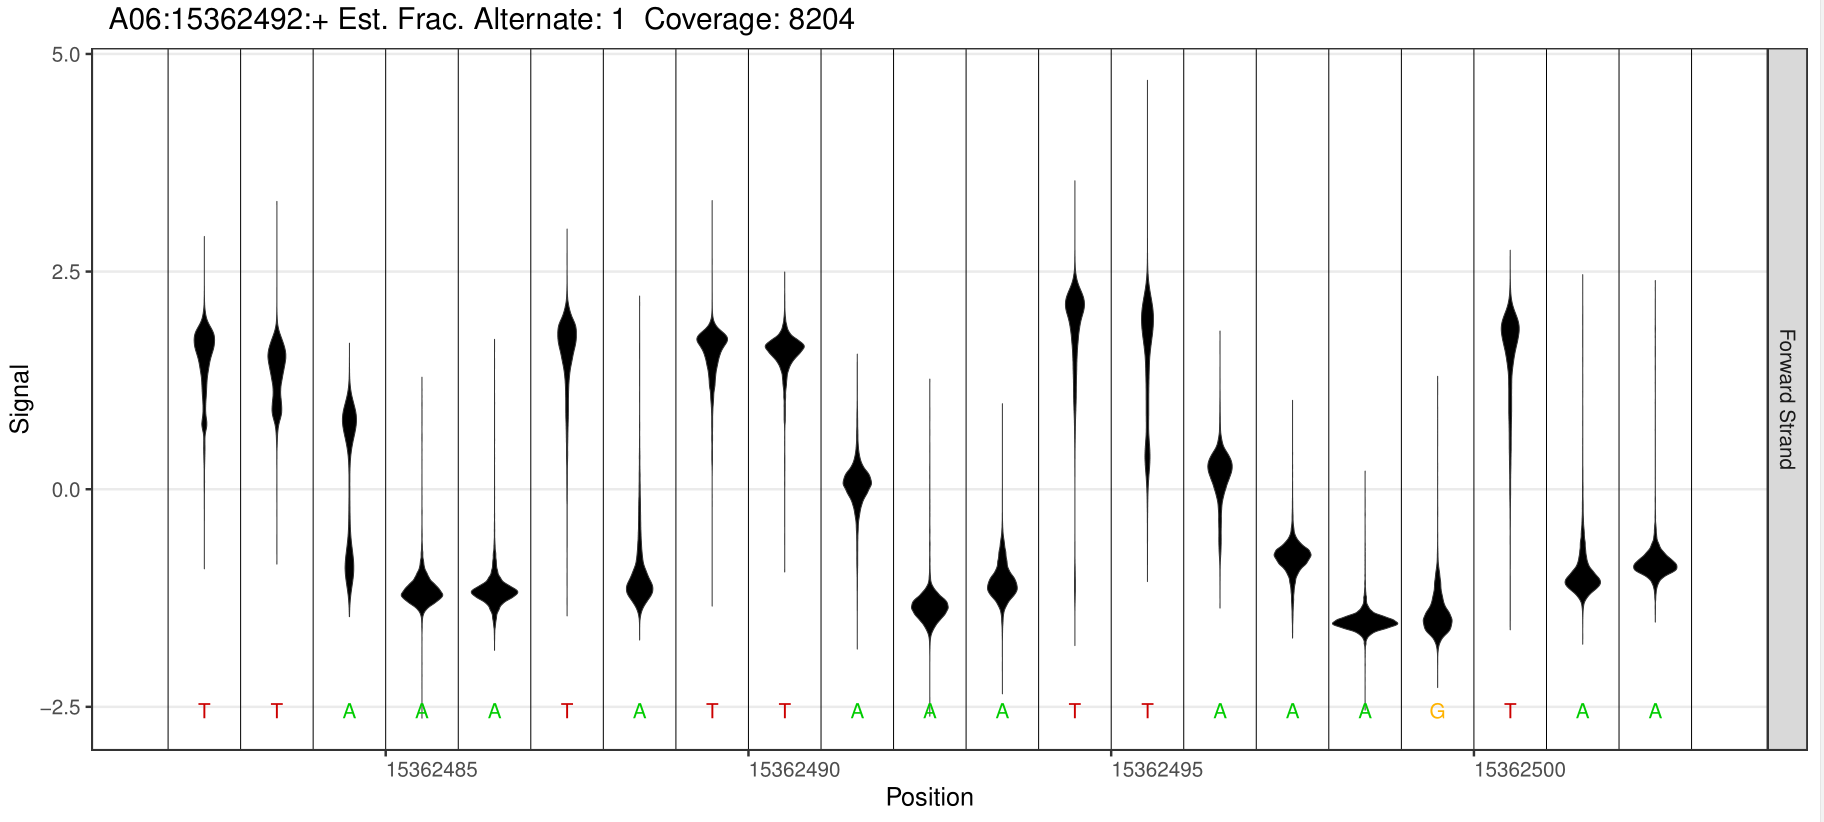
6mA Site Detection
2.Identification of different methylation sites
Genomic regions with significant differences in methylation modification levels reflect the differences in regulation between samples to a certain extent. These regions can be structurally annotated using the genome location and the genome structure annotation information of these differential sites.
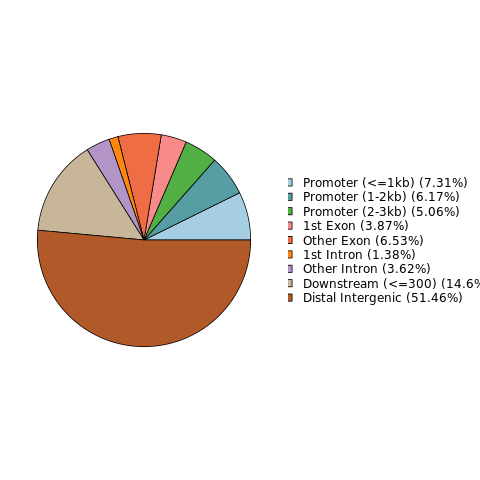 Notes on the structure of differential loci
3.Enrichment analysis of genes related to differentially methylated regions
3.1 GO enrichment analysis
Gene Ontology (referred to as GO) is an internationally standardized gene function classification system that can comprehensively describe the attributes of genes and gene products in organisms. GO enrichment analysis of genes with differentially methylated regions provides valuable information about biological functions, cell composition, and biological processes of methylation-regulated genes.
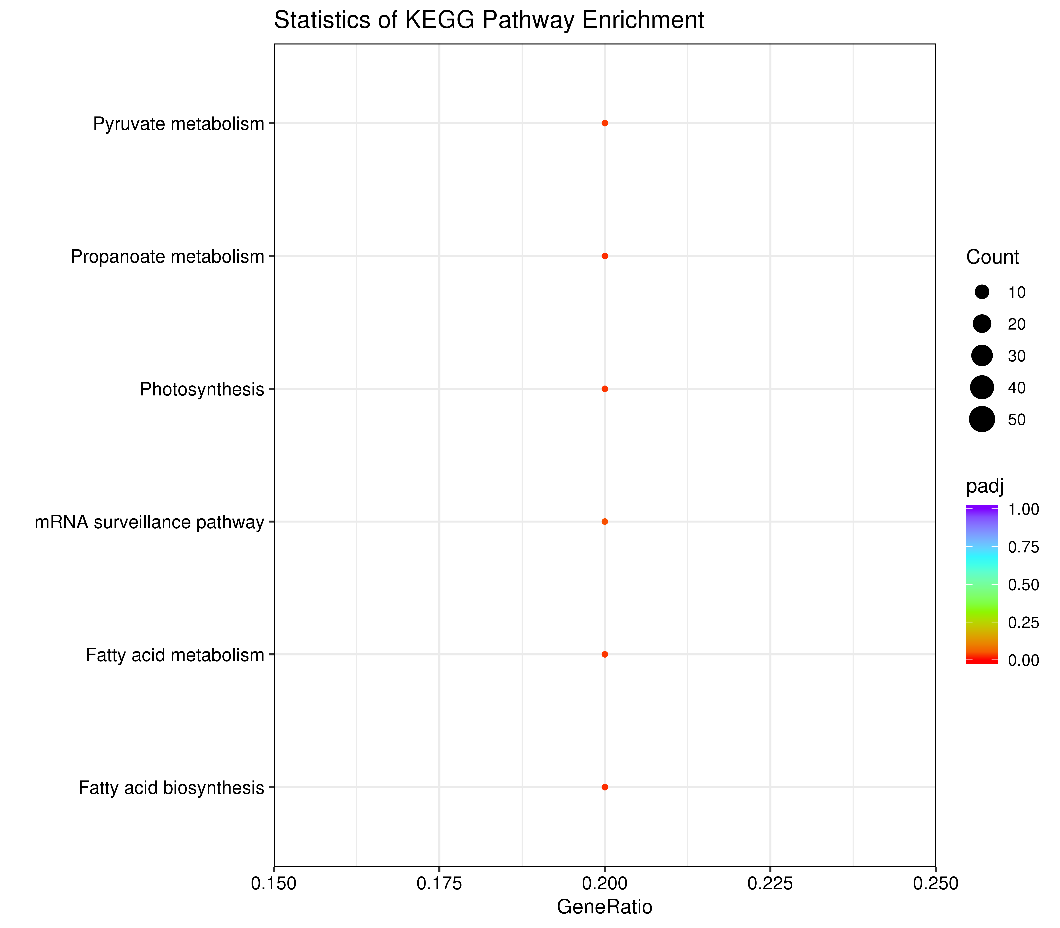
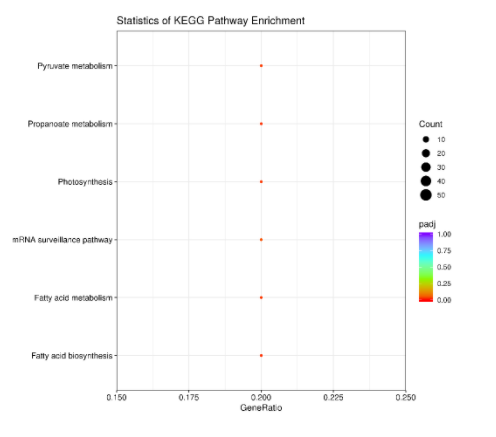
3.2 KEGG enrichment analysis
The KEGG metabolic pathway database covers the biochemical metabolic pathways and signal transduction pathways of various species. The significant enrichment of KEGG can determine the main biochemical metabolic pathways and signal transduction pathways involved in differentially methylated regions related genes.
Case Analysis
Case Analysis
Case Analysis
PacBio’s third-generation sequencing technology obtains 6mA modification map of Arabidopsis whole genome
This is the first domestic study on 6mA modification of eukaryotes based on PacBio single-molecule sequencing technology, revealing the occurrence of 6mA modification in Arabidopsis thaliana and providing a basis for studying the distribution pattern and potential functions of base modifications in terrestrial plants. The Wuhan Futuromics provides PacBio sequencing services and has rich experience in such third-generation sequencing projects. DNA methylation is an important part of epigenetic regulation, and it plays an important role in regulating genomic imprinting, X chromosome inactivation, transposon silencing, gene expression, epigenetic memory, embryonic development, and tumorigenesis.
Overview
The researchers first used the Dot blot method to detect the 6mA modification levels in different tissues and different developmental stages of Arabidopsis, and then selected D9 and D21 samples for three-generation PacBio SMRT whole-genome sequencing. They compared the distribution models and dynamic changes of Arabidopsis 6mA modifications in the two periods, and combined transcriptome information to further study the potential functions of 6mA.
Results
- 6mA modifications are widespread in the Arabidopsis genome
The researchers first used the Dot blot method to detect the level of 6mA modification in different tissues and different developmental stages of Arabidopsis, and found that 6mA was widely present in these samples to varying degrees. The level of 6mA gradually increased as ontogeny progressed, and rose sharply on D21.
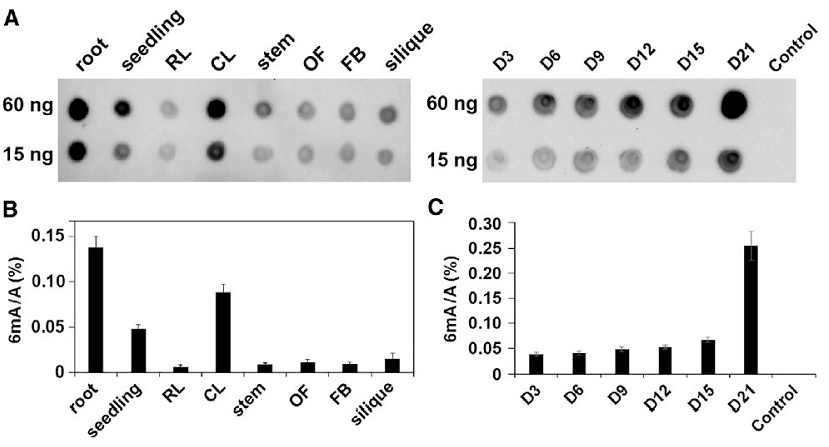
Dot blot method to detect 6mA modification levels in different tissues and different developmental stages of Arabidopsis
- Use PacBio SMRT sequencing to obtain a 6mA map of the Arabidopsis whole genome
Taking the D9 sample as an example, the PacBio SMRT sequencing depth is 103×, higher than the PB official recommendation of 100× for measurement of whole genome methylation. Using the interval time between two pulsed fluorescent signals during sequencing as a marker, the degree of methylation of the site was evaluated, allowing researchers to obtain chain-specific D9 whole genome 6mA information. The experimental results showed that among all 29,811 adenines in the mitochondria, chloroplasts, and nuclear genomes, the rate of 6mA base modification was 0.04%, which was consistent with the 0.048% evaluated in the LC-MS/MS experiment. Areas closer to the centromere showed a higher 6mA abundance and a slightly lower average methylation level.
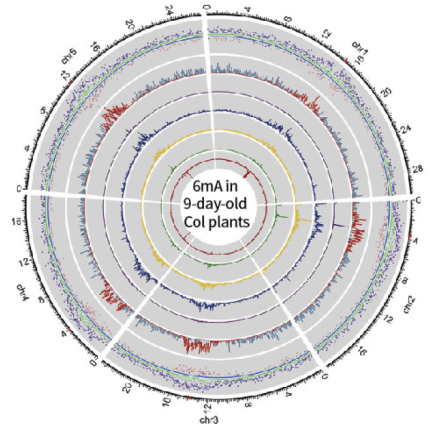
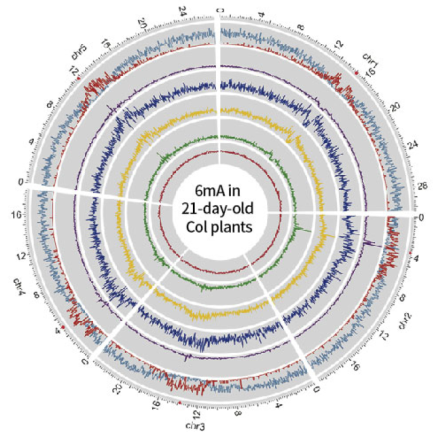
D9 and D21 Arabidopsis whole genome 6mA map
- Analysis of 6mA distribution mode
By evaluating 6mA in different regions of the genome (Exon, Intron, 5’UTR, 3’UTR, Fig.5A) and different types of genes (Protein coding, miRNA, snoRNA, etc., Figure B, C below) According to the 6mA distribution model, 6mA is more abundant in the gene body region than the intergenic region.
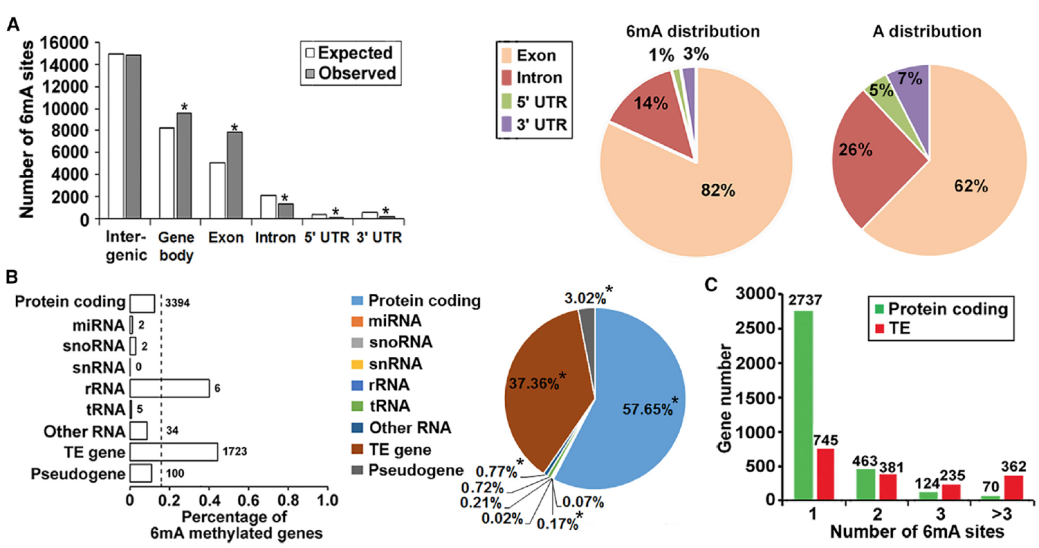
6mA distribution pattern in Arabidopsis (D9)
- During the development of Arabidopsis, 6mA modification is dynamic
From a comparison between the D9 and D21 Arabidopsis whole genome 6mA distribution map, overlap relationship, and difference in distribution mode, we can know that during the development of Arabidopsis, the 6mA modification changes dynamically, and there are obvious differences in location and degree.
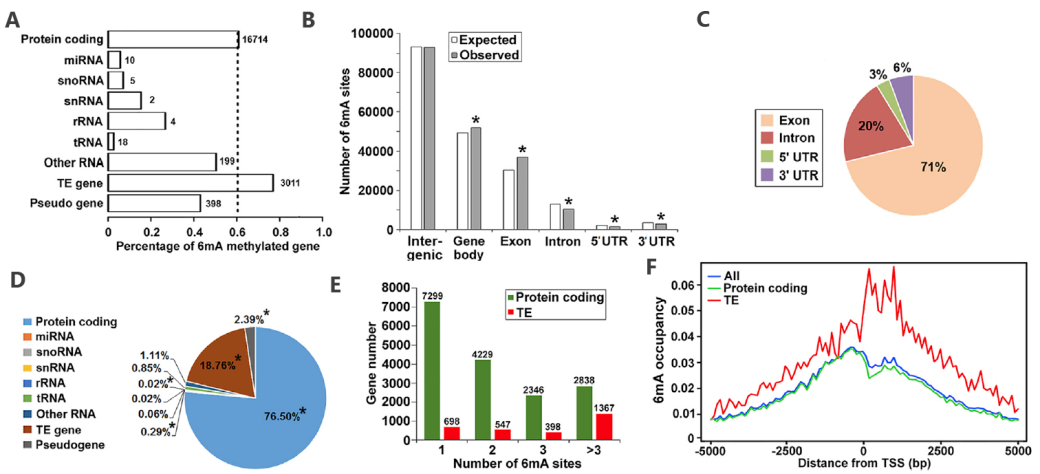
6mA distribution mode (D21)
- 6mA is associated with genes actively expressed in Arabidopsis
By combining the 6mA modification site and degree with the gene expression information from RNA-seq, the results show that 6mA is associated with genes that are actively expressed in Arabidopsis. There are more 6mA modification sites in the upper and lower 2.5kb region of TSS of highly expressed genes. The expression level of 6mA modified genes is significantly higher than that of unmodified genes, and the difference is more obvious when they are close to TSS.
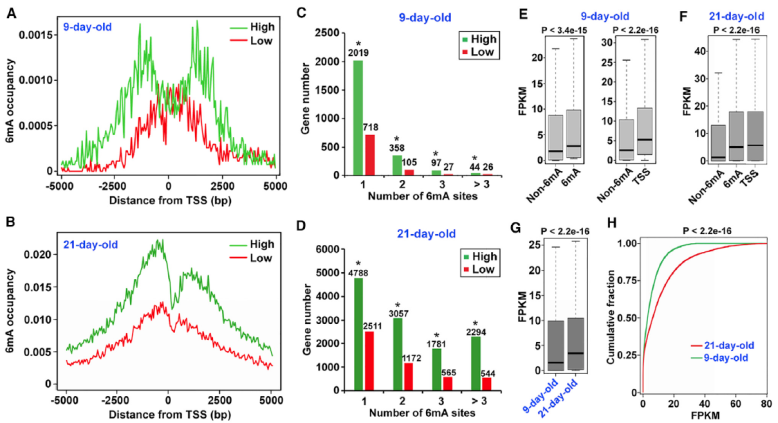
Association analysis of 6mA modification and RNA data
References: Liang, Z. et al. DNA N6-Adenine Methylation in Arabidopsis thaliana. Developmental Cell, 2018.


