Product Advantages
Rapid: K-mer analysis methods, allows the rapid identification of genome characteristics
Professional: Different algorithms and software for simple genomes and complex genomes (high heterozygosity, polyploidy)
Methodology
| DNA Sample Amount | Library Construction Methodology | Sequencing Methodology |
| Total ≥ 1 μg | Illumina PE150 Standard Library; or MGI PE150 Standard Library | Advised Depth of Data ≥ 50X |
Analysis
- Raw data quality control
- Data Contamination Detection
- Genome size estimation
- Genome Heterozygosity estimation
Results
1. Raw data quality control
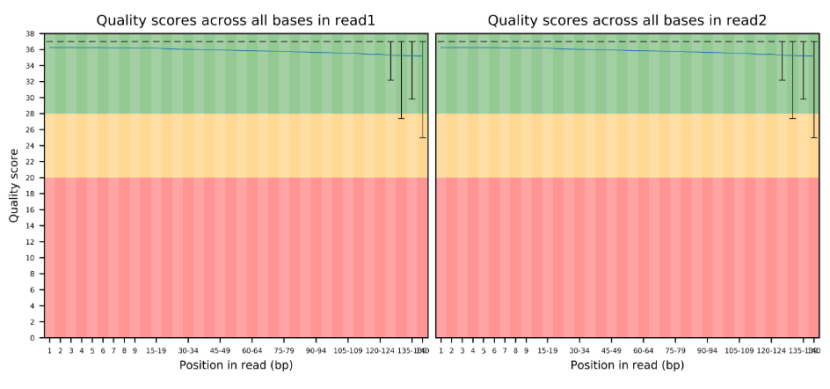
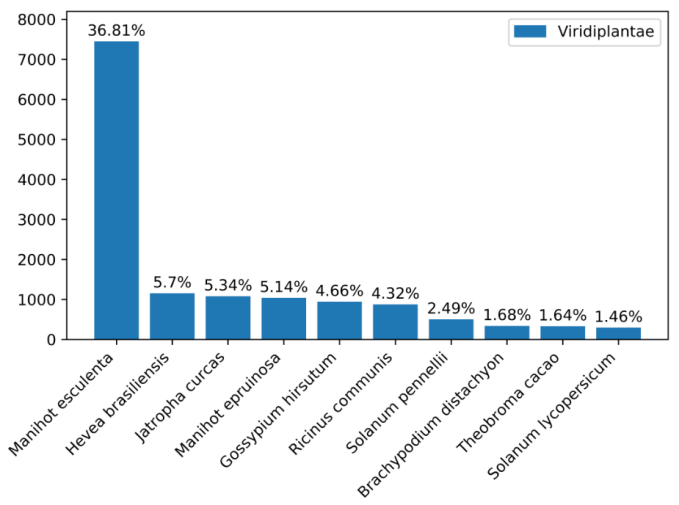
For quality control (QC), the raw data is first filtered. Subsequently, the raw data and the cleaned data are categorized by quality. 100,000 QCed reads are taken to assess the distribution of reads in the nt library and the distribution of species in comparison as markers for data contamination evaluation.

 Picture 1 a. Base Quality Distribution b. Main Species Distribution
2. Genome Size and Heterozygosity Estimate
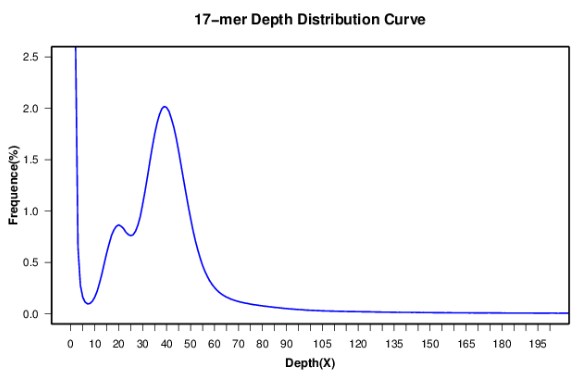
The skew normal distribution model and negative binomial model are used for the fitting analysis of K-mer data, allowing subsequent evaluation of the size and heterozygosity of the genome and the production of the final genome evaluation report.
 Picture 2 17-mer distribution curve
GC-Depth Analysis and Contamination Evaluation
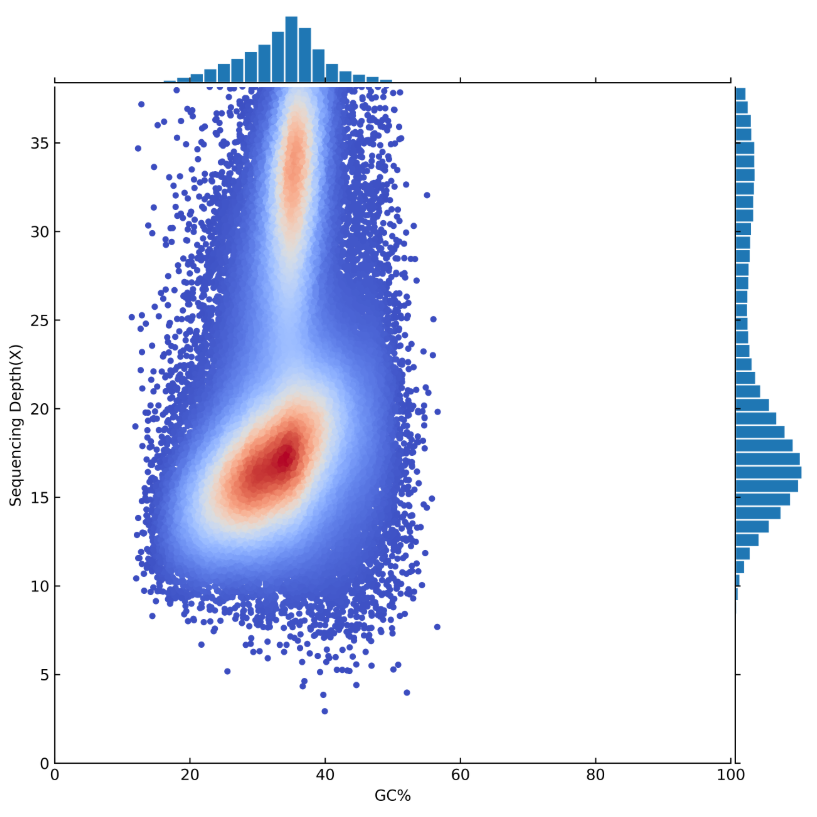
Using 5kb as the window for assembled genome sequences, we take the average GC-content and the average depth of non-duplicate fragments and generate a visualization. Visualizations are based on the average GC- content and the average depth for each particular window. This diagram can be used to analyze the sequencing data for GC bias and contamination.
 Picture 3 GC-Content and Depth Visualization
Common Questions
1 How do I find the size of my genome
Find the sizes of plant genomes at:https://cvalues.science.kew.org;
Find the sizes of animal genomes at :http://www.genomesize.com/search.php.
Converstion:1pg=978Mb
2 Why should I do a genome survey before completing a third-generation sequencing assembly?
Surveys are effective measures for evaluating the complexity of a genome and provide valuable information about the size and heterozygosity of the genome, which directly affect the sequencing strategy and duration of a subsequent assembly.
3 What is the difference between a survey evaluation and a flow cytometer evaluation?
Both estimate the size of a genome, but a survey evaluation uses statistical methods that produce estimates of both size and heterozygosity simultaneously. A flow cytometer evaluation uses experimental methods to analyze genome size, and requires the genome size of a known reference species to evaluate the size of a genome. Since the selection of this reference species will vary, the estimated genome size will include a degree of error. Comparatively, a survey obtains data that is both more accurate and more comprehensive.
4 Is a flow cytometer evaluation not required after I complete a genome survey?
No. It is generally recommended that a flow cytometer evaluation is completed before the genome survey to obtain a preliminary estimate, especially for species that have complex genomes and are lesser known. This is more convenient for the estimation of the amount of sequencing data after survey analysis, and allows verification of survey results. In K-mer analysis, we categorize the highest K-mer peak as the main peak, peaks about ½ before the main peak as heterozygous peaks, and peaks 2 times after the location of the main peak as repeat peaks. At this point, a flow cytometer evaluation is recommended for the validation of this judgment.
5 In a survey analysis, how do I pick the length of my K-mer?
Conventionally, 17-mers are used to evaluate genome sizes, as the combination possibilities of nucleotide fragments with a length of 17 range from 417-17G, ample enough to cover normal genomes. If 15-mers are chosen, then there is only a possibility of 1G, which may not be enough to cover a normal genome and can cause inaccuracy. For larger genomes >15G, we may use 19-mers or 21-mers for evaluation. Since inaccurate nucleotides can appear, K-mers are not the larger the better. In fact, the larger the K-mer,the more K-mers including the inaccurate site there are. Additionally, to avoid palindromes, K-mer analysis always involves K-mer lengths that are odd.


