Product Advantages
Compared to other short-read length sequencing technologies
- Long read length; longest reads can reach 2Mb, which can easily span most repetitive sequence regions or heterozygous regions.
- There is no PCR process during library construction and sequencing, no GC preference, and more complete and uniform genome coverage.
- Can easily detect larger insertions, provide its sequence information, and identify its sequence type to see if it is caused by the insertion of complex repetitive sequences such as transposons.
- Can detect other more complex structural variations, and the identification accuracy rate is higher.
Compared to other long-read sequencing technologies
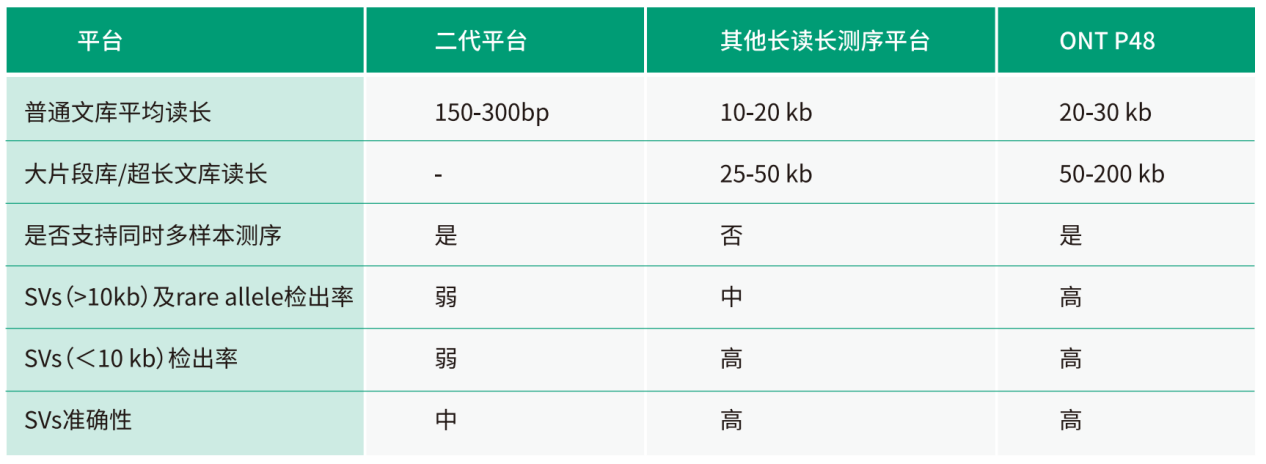
- Longer read length, higher detection sensitivity.
Other long-read sequencing platforms require multiple cells to achieve the amount of data required for SV calling, and thus cannot meet the requirements for simultaneous sequencing of multiple animal and plant genome samples. On the other hand, ONT PromethlON48 (P48) has obvious cycle advantages in population genome research. P48 can parallelly run up to 48 samples at the same time, with single cell output reaching nearly 30× the data volume requirements of most species, greatly reducing the time required for population sequencing.
- Higher sequencing throughput, saving research cycle
The average read N50 length of ONTP48 is 25-40 kb, while the read N50 length of the Ultra-long reads library method can reach more than 100 kb. Thus, ONTP48 has a higher detection capability in repeated regions and can cover more complete SVs, enhancing the detection sensitivity of large SVs (>10kb) and rare SVs.
Strategy
Analysis Content
Results
Structural Variation Detection
Based on comparison to the reference genome sequence, all potential SV mutations in the whole genome of each sample are detected by structural variation detection and analysis software.
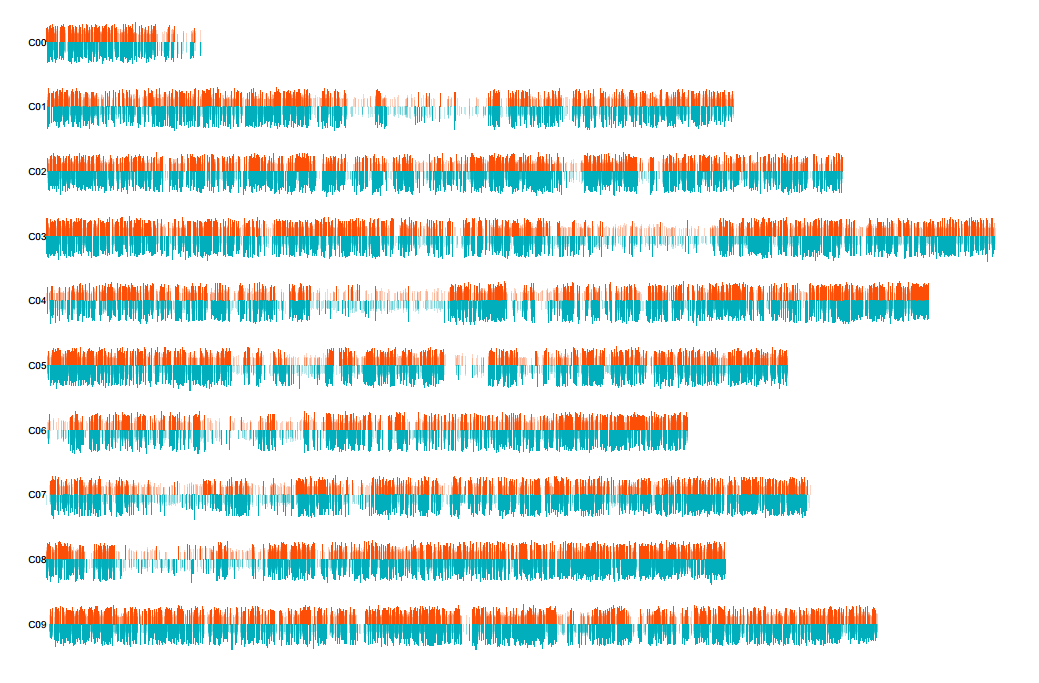
Figure 1 SV chromosome distribution map
Enrichment analysis of important SV-related genes
SVs that occur in gene exons and in upstream or downstream regulatory regions are more likely to have a greater impact on genes. Following shows the enrichment analysis of SV-related genes occurring in exon, upstream, or downstream regions in the annotation results.
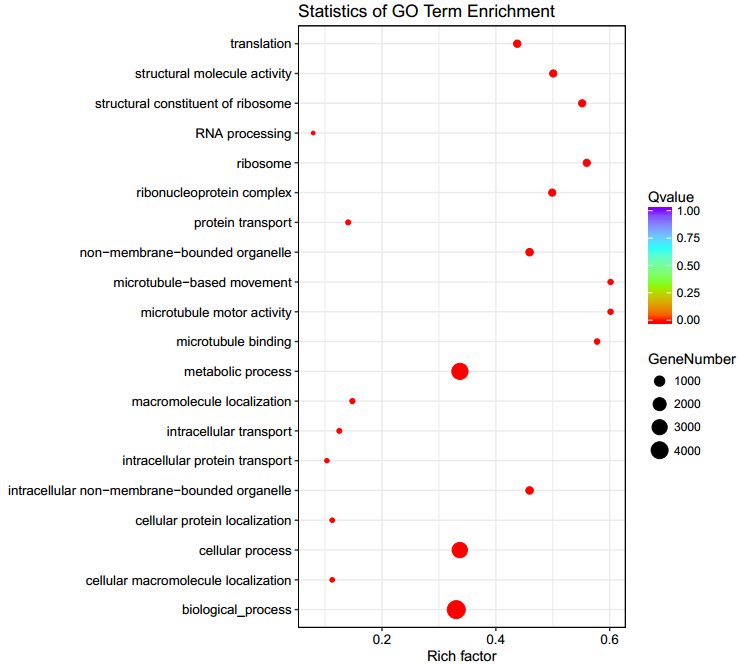
Figure 2 GO analysis statistics. The x-axis is the Rich Factor, which represents the percentage of genes on the enrichment to the annotated genes; the y-axis represents the entries on the enrichment; the size of the dots represents the number of genes on the enrichment, and the color represents the Qvalue (the lower the QValue, the more significant the results).
Population Structure
Population structure is an intuitive manifestation of differences between groups. The greater the difference between groups, the more obvious the structure displayed.
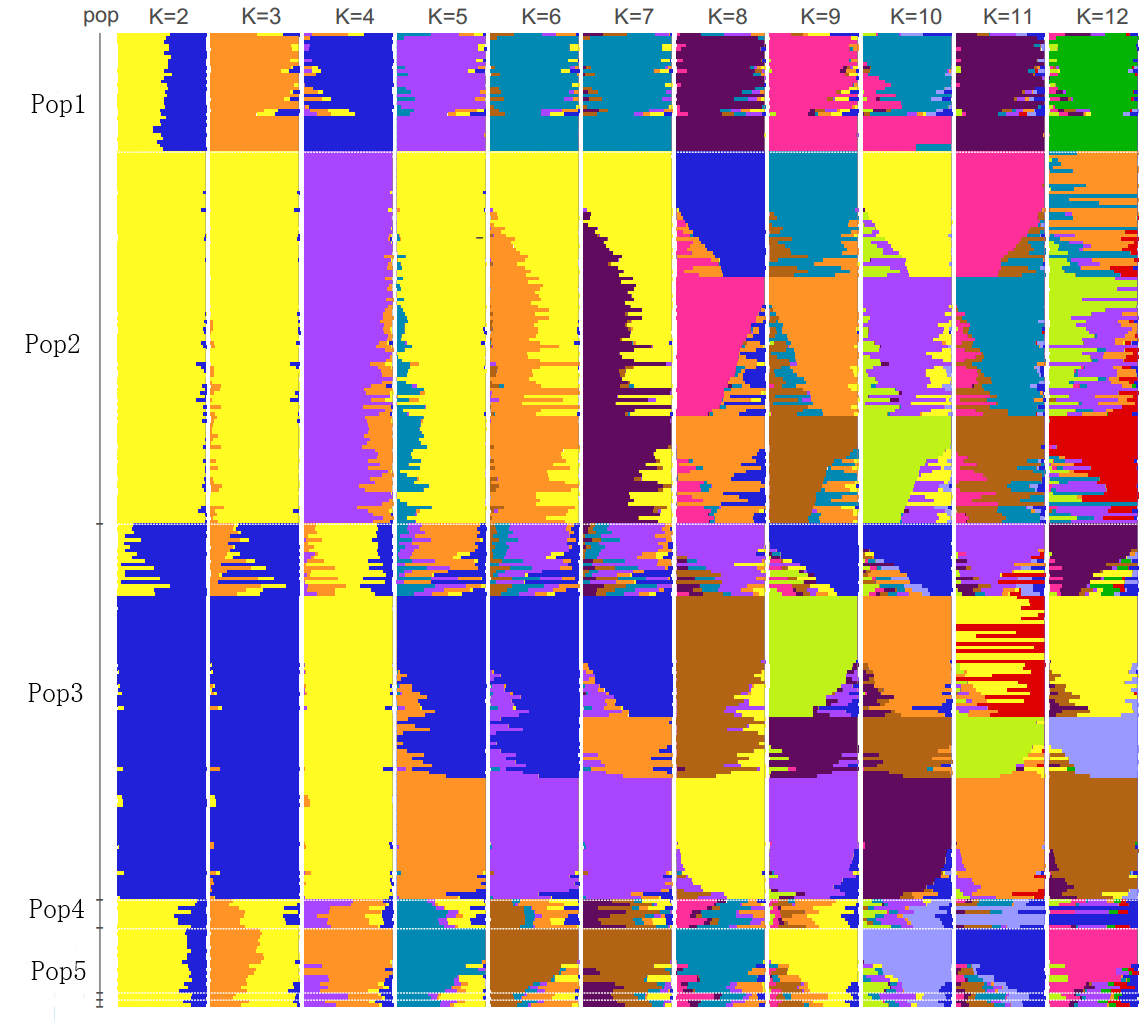
Figure 3 Integration diagram of group structure.
Each vertical subgraph is the grouping result of a specific K; the horizontal category includes different samples, each corresponding to each K one-to-one. The color label represents population information under each K, but the colors between K and K do not have any relationship, that is, the yellow in K=4 and the yellow in K=5 do not represent the same group and are entirely independent.
SV identification of differences between groups
Fst (Fixation index, fixed index) is a commonly used index to measure the degree of population differentiation caused by differences in genetic structure. The calculation of Fst requires at least two groups; the larger the Fst value (1≥Fst≥0), the greater the differentiation between groups.
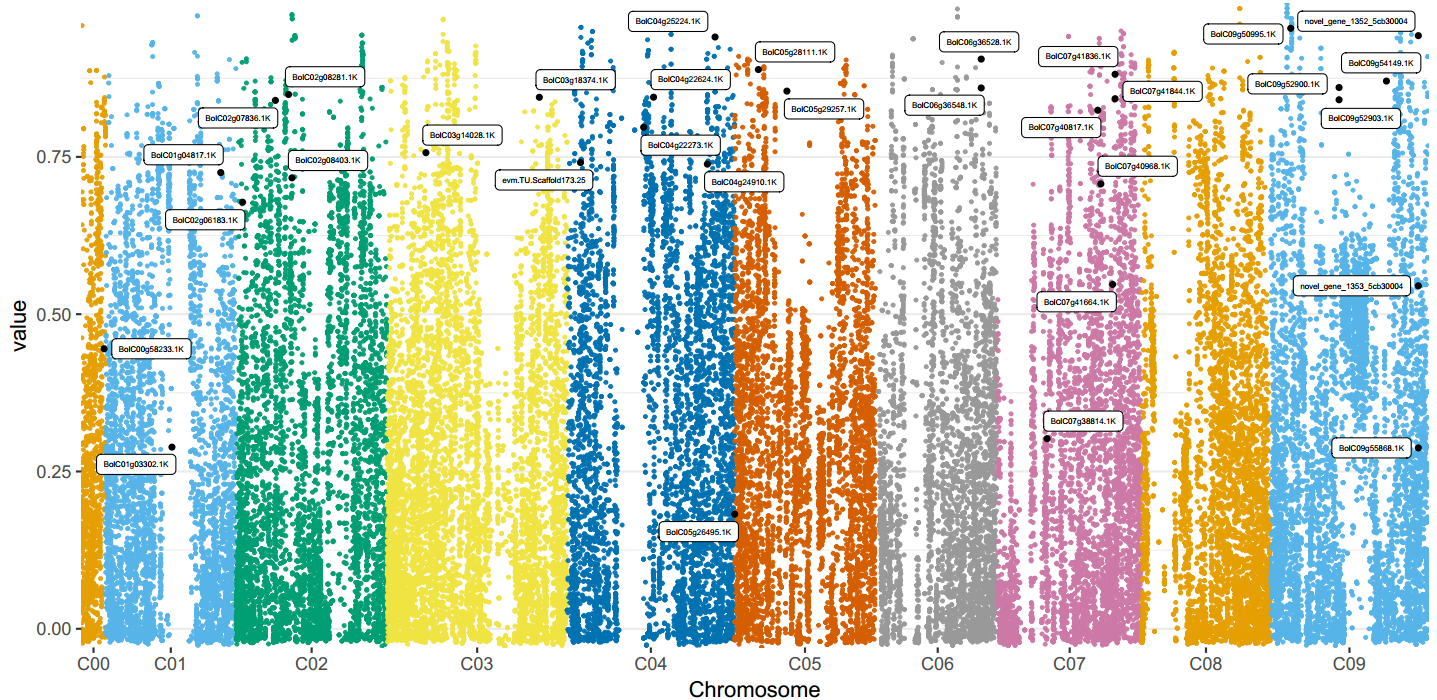
Figure 4 Fst and highlighted key genes.
In the figure, each color represents the results of a chromosome, and each dot represents the Fst result value of an SV; the position of the black dots is the Fst value corresponding to the highlighted SV, and the gene next to it is the gene annotated to the SV.
Case Analysis
Case Analysis
Nanopore sequencing to identify structural variations in the human genome (Yoruban NA19240)
Structural variants in the human genome (Structural variants SVs) are defined as DNA regions with a copy number or position change greater than 50bp, including copy number variants (CNV), inversions, translocations, mobile element insertions, and expansions of repetitive sequences. Short-read technology performs poorly in the detection of most SVs. The development of long-read sequencing technology makes it possible to accurately detect SVs in the genome. Researchers used the Nanopore PromethlON sequencing platform to sequence the human Yoruban NA19240 genome, and analyzed the data to evaulate the accuracy and sensitivity of multiple SV comparison and detection tools (LAST, Ngmlr, Minimap2, Sniffles, NanoSV, etc.) Furthermore, researchers also discussed the best parameters of the above tools for the production of a set of SVs with high confidence and sensitivity. Among them, the comparison tool Minimap2 and the structural variation detection tool Sniffles showed the highest accuracy and computational efficiency in this study. Finally, the described methodology for SV detection using the Nanopore PromethlON can be extended to other individuals or groups for long-read sequencing and SVs detection.
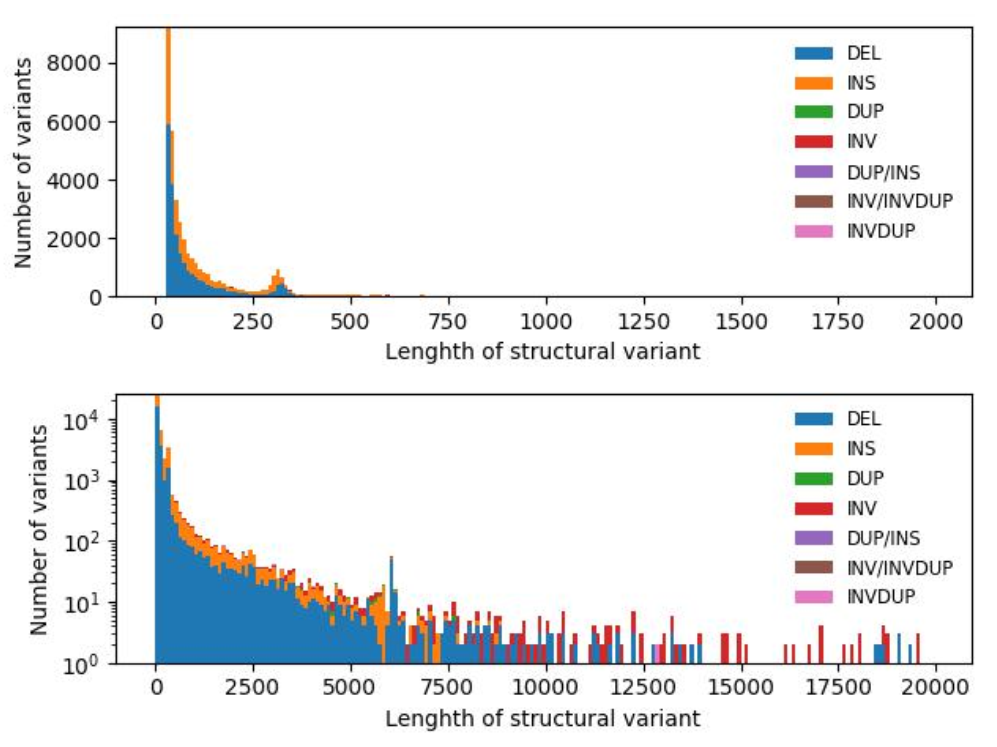
图1 不同类型SVs长度分布
Population Genetics of Structural Variation in Grape Domestication
At present, little is known about the type, size, distribution and population dynamics of SVs in individuals in plant research. Understanding these dynamics is essential for understanding the contribution of SV to phenotypes in GWAS association analysis. This study supports our understanding of plant genome evolution by investigating the variation of SVs at the population level in wild and domesticated grapes. The researchers first assembled the highly heterozygous “Chardonnay” grape genome using third-generation sequencing technology, and then compared the genome with the “Cabernet Sauvignon” grape genome. Using the SVs of these two genomes, the SVs of another 50 grape varieties and 19 wild ancestor populations were typed, resulting in 481,096 SVs after strict filtration. Analyzing this set of SVs, researchers revealed the selection intensity of different types of mutations within the population, among which TRAS and INVs were more selective. Simulataneously, the effect of the transition from hybridization to asexual reproduction on cultivated grapes was discussed. A 4.82Mb inversion (b) was found in a gene region where the SV difference between cultivated grapes and their wild ancestors is particularly significant. This variation and the semi-absence of the MybA gene together lead to the formation of white berry grapes.
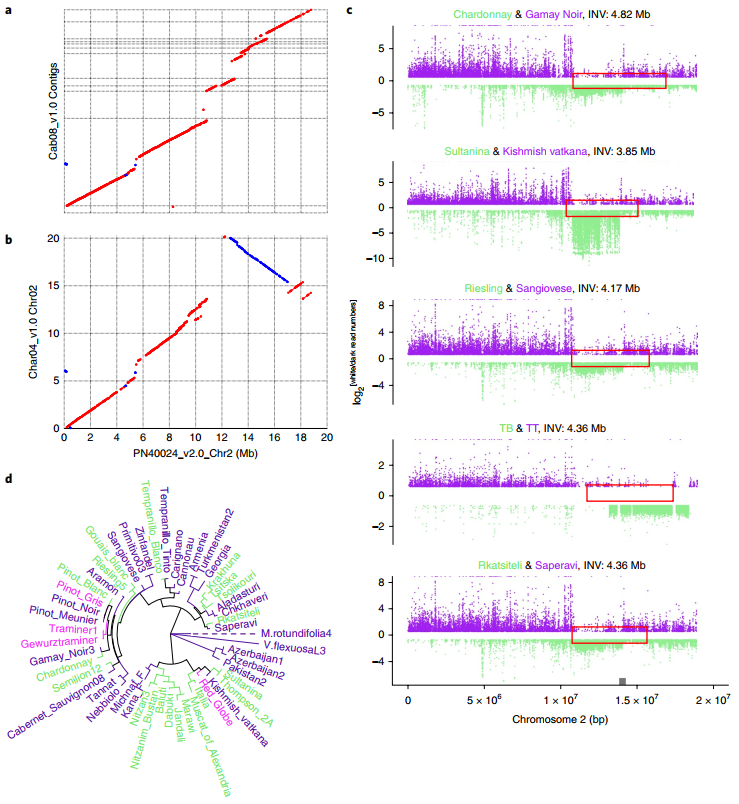
图2 栽培葡萄与其野生祖先之间4.82Mb倒位基因区域


