Product Advantages
Diversified platform: Nanopore, PacBio, bionano, Hi-C, and other technological platforms combined to provide a one-stop genome assembly service.
Ultra-long reads: 50-100Kb Reads N50, easily sequencing large repeating fragments in the genome
Autonomous assembly algorithm: NextDenovo, NextPolish autonomous assembly algorithm can be optimized based on different genome characteristics of different species
Rapid cloud assembly: Huawei Cloud GeneContainer Service provides powerful concurrent processing of sequence analysis, effectively avoiding task deadlock and reducing waiting time.
Ample Project Experience: As the first domestic provider of third-generation sequencing services, Genomics has ample experience in pure third-generation animal and plant genome de novo assembly. Since 2016, we have finished the near completion maps of the peanut genome, apple genome, and the indica R498 genome; we have finalized multiple genome projects including the HX1 genome project, publishing 18 high-level journal articles about genomics (IF>10).
Methodology
| Simple Genome | Complex Genome | Super-large Genome | Genome Near-Completion Map | |
| Definition | Genome Size<2Gb Heterozygosity<0.5% Repetitive Sequence Ratio<50% | Genome Size>2Gb Heterozygosity>0.5% Repetitive Sequence Ratio>50% | Genome Size>10Gb | Assemble super-perfect genomes based on top strategies |
| Library type | PacBio CLR Library Nanopore Ligation 1D Library | PacBio HiFi reads Library Nanopore Ultra-long reads Library | ||
| Sequencing strategy | 50×NGS+50-80×TGS+100×Bionano+100×Hi-C+ | 50×NGS+100× TGS +100×Bionano+100×Hi-C | 50×NGS+50-100×Ultra-long reads+100×Bionano+100×Hi-C | Ultra-long reads+HiFi reads+Bionano+Hi-C |
| Contig N50>1Mb Scaffold N50>5Mb | Dependent on specific species | – | – | |
Analysis
| Data output and data quality control | |
| Genome Assembly | 1. Assembly 2. Assembly Evaluation |
| Genome Annotation | 1. Repeat Annotation 2. Gene Prediction 3. Gene Function Annotation 4. ncRNA Annotation |
| Evolution Analysis | 1. Gene family identification 2. Unique/shared gene analysis 3. Construction of evolutionary tree 4. Time of species differentiation 5. Contraction & expansion of gene family analysis 6. Identification of orthologous genes 7. Positive selection gene analysis 8. Prediction of genome-wide replication events (certain species) 9 Prediction of large fragment replication events (requires chromosome construction) |
| Personalized Analysis | Design personalized analysis strategy based on species characteristics |
Results
Genome Assembly
Grandomics has completed the sequencing assembly of multiple large genomes above 10Gb based on nanopore sequencing technology. With high-quality nanopore long read data and the NextDenovo assembly algorithm, the Contig N50 of large genomes obtained is at the Mb level, and the continuity of the genomes are also exceptionally high.
| Sample | Heterozygosity (%) | Long reads Data(Gb) | Nanopore Reads N50(Kb) | Assembly size (Gb) | Contig N50(Mb) | Contig Number (#) | BUSCO(%) |
| Dicotyledonous plant 1 | 1.9 | 1,066 | 23.26 | 16.75 | 1.96 | 12,117 | 82.33 |
| Dicotyledonous plant 2 | – | 800 | 26.21 | 10.74 | 12.73 | 5,274 | 83.58 |
| Monocotyledonous plant 1 | – | 1,027 | 50.46 | 10.76 | 93.26 | 329 | 97.75 |
| Monocotyledonous plant 2 | 0.7 | 754 | 30.98 | 10.80 | 5.84 | 3,872 | 80.47 |
| Gymnosperm | – | 896 | 23.12 | 10.92 | 9.99 | 4,432 | 82.43 |
Gene family analysis
Cluster analysis of gene families with OrthoMCL

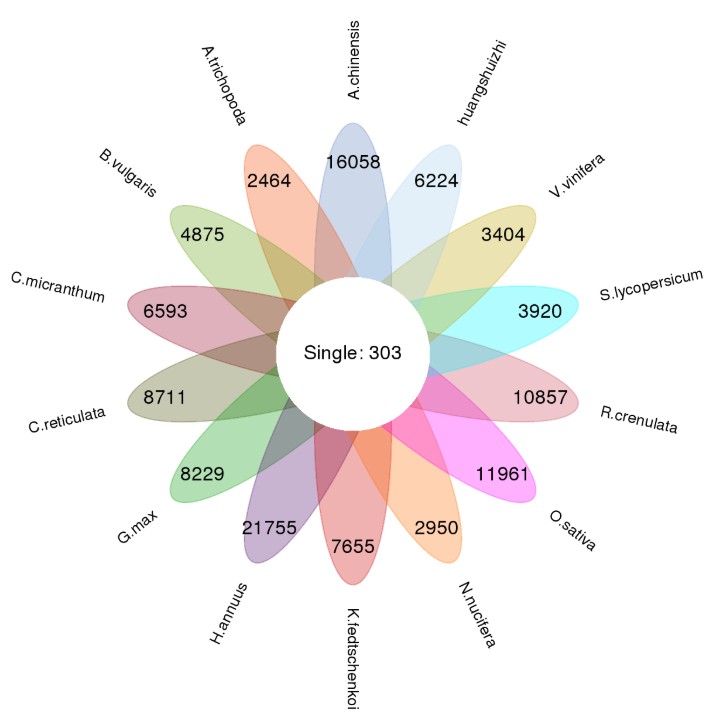
Fig. 1a Classification of gene family types in each sample, b Petal map of single copy genes and species-specific genes
Build a phylogenetic tree
The process of constructing a phylogenetic tree is actually the process of inferring the ancestral state by using homologous traits (such as a column position in MSA) and homologous states.
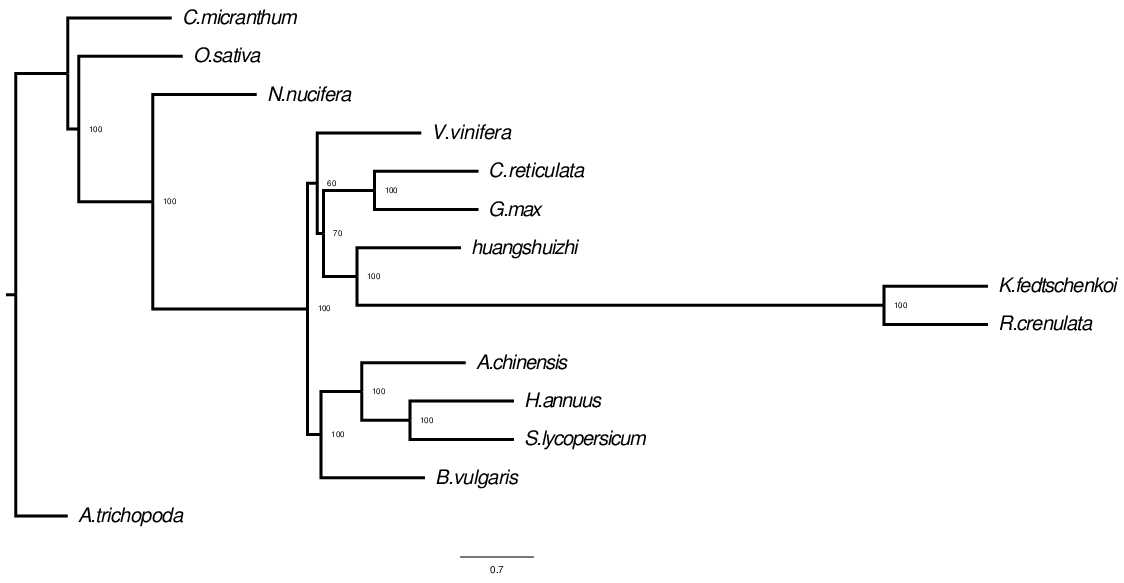
Fig. 2 Evolutionary tree structure
Estimate divergence time
Divergence time is a hotspot in current evolutionary analysis. Taking the fossil record of a specific group as a reference point, the divergence time between branches is estimated by the degree of divergence between gene sequences and the molecular clock. Simultaneously, the occurrence times of other nodes on the phylogenetic tree are calculated, so as to infer the origin time of related groups and the differentiation time of different groups.

Fig. 3 Differentiation time estimation chart
Gene family contraction and expansion analysis
During the evolution process, due to various selection pressures, genes will expand and contract. Through the identification of gene families and comparative analysis of ancestor data, we can know whether gene families of different species have undergone large-scale expansion, contraction, or even loss, and use this information to infer its natural selection pressure. Using the index files and divergence time of species in gene families, the evolution of gene families of different species in each evolutionary branch is obtained.

Fig. 4 Gene family expansion and contraction
Whole genome duplication analysis
Whole Genome Duplication is an important event in the history of biological evolution, and has important significance in the origin of species and genome expansion. The 4DTV (four-fold synonymous third-codon transversion) value and the synonymous substitution rate Ks can help us analyze whether the species has a genome-wide replication event in the evolutionary history.
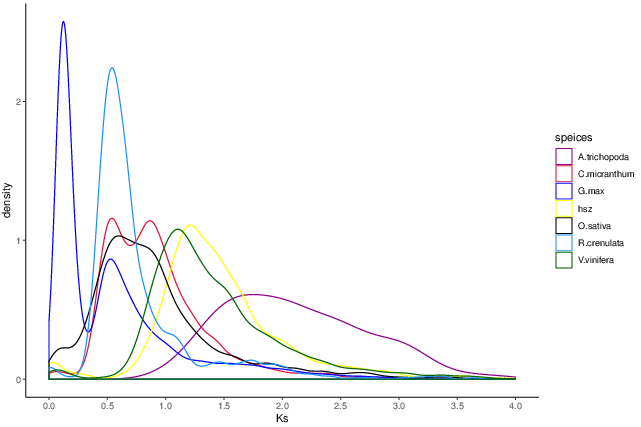
Fig. 5 Distribution of Ks for different species
Common Problems
1 How should I evaluate the de novo assembly results?
De novo assembly evaluation usually includes three aspects: continuity, completeness and accuracy.
Generally, contig N50 and scaffold N50 are used to measure continuity. N50 refers to the arrangement of assembled contigs or scaffolds from large to small. When the cumulative length just exceeds 50% of the total length of the entire assembly sequence, the size of the last contig or scaffold is the size of N50. Completeness is evaluated with BUSCO (Benchmarking Universal Single-Copy Orthologs), which assesses the genome according to the level of gene content. Sequence accuracy of TGS assembly results is currently assessed with high-quality second-generation sequencing (NGS) data at the single-base level.
2 What are the advantages of PacBio/Nanopore sequencing?
The sequencing and splicing assembly of animal and plant genomes (pure TGS assembly) have solved many problems raised by traditional sequencing technologies, such as high heterozygosity, highly repetitive regions, and abnormal GC content regions. This has greatly improved genome assembly indicators, now almost 10-20 times more than previous NGS sequencing technologies.
3 How does Nanopore Ultra-long reads help genome assembly?
The unique Ultra-long sequencing of the Oxford Nanopore Sequencing Platform can generate ultra-long sequencing fragments, easily span consecutive or repeated regions of large fragments in the genome, and restore the true genomic landscape to a greater extent.
Easily cross repeated areas
NGS cannot cross certain “dark areas” in the genome due to its short-read length, and regular TGS libraries cannot solve them either. Ultra-Long Reads can easily cross consecutive repeat regions, provide more sequence information, and facilitate the division of repetitive fragments in the assembly process.
Significantly improve assembly quality
In the process of genome assembly, the ideal assembly quality can be obtained by increasing the read length. Adding Ultra-Long Reads data can significantly improve the assembly effect of the human genome, fill the gaps in the genome, and even assemble a complete chromosome including its telomeres.
Case Analysis
Tetraploid cultivation of peanut genome reveals secrets of legume karyotype, polyploid evolution and crop domestication
The cultivated peanut (Arachis hypogaea L.) is heterotetraploid (AABB, 2n = 4x = 40), and the close relationship between its subgenomes and the high proportion of repetitive sequences significantly increase the difficulty of assembling the cultivated peanut genome. This study deciphered the whole genome of the tetraploid cultivated peanut for the first time worldwide, providing insight for research regarding the origin of peanut chromosomes, karyotype evolution of peanut and major legume groups, peanut genome structure variation, origin of the peanut species, and molecular breeding.
Sequencing, assembly and annotation
In this study, Arachis hypogaea var. Shitouqi peanuts were sequenced. 100x PacBio data was preliminarily assembled (average read length 10.25Kb) to obtain a Contig N50 of 1.51Mb. Then Hi-C data was used to raise the assembly result to the chromosomal level, with an N50 of 129.8 Mb. Finally, a high-density genetic map was used to adjust the results of 5 Hi-Cs with slight assembly errors, resulting in a 2.51Gb tetraploid cultivar peanut genome with 20 chromosomes. In order to evaluate the quality of the assembly, the data was compared with published peanut BAC double-end sequencing data. The three peanut full-length BAC sequences showed a high degree of consistency. In addition, the NGS data and the TGS data were compared on the base level to evaluate continuity and accuracy. All evaluation results indicate a high-quality assembly of the peanut genome. A total of 30,596 non-redundant genes were identified from the peanut genome, and 24,208 homologous gene pairs showed wide differential expression between the two subgenomes, with the dominant expression frequency of subgroup B being higher than subgroup A.
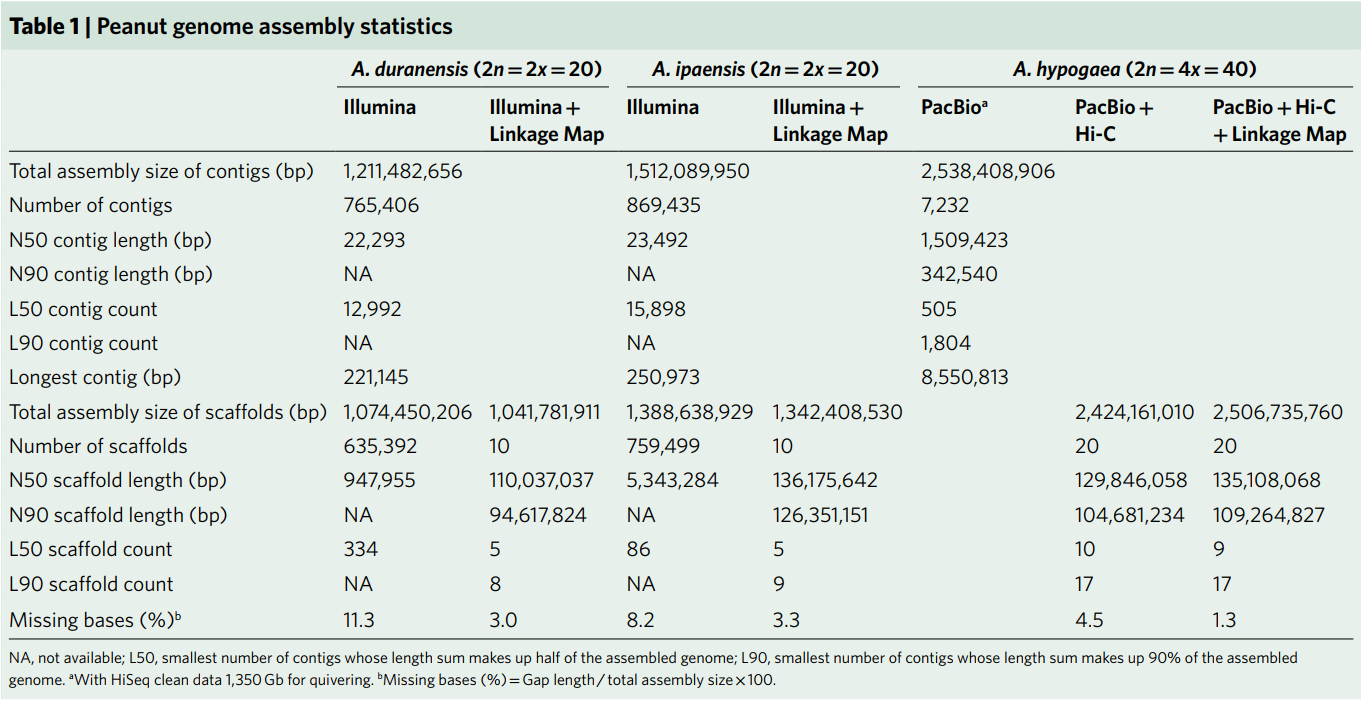
Table 1 Peanut genome assembly statistics
Subgenome structural characteristics
Subgenomic structural characteristics Comparative genomic results showed that the agreement between peanut cultivar subgroup B and diploid A. ipaensis was higher than that between subgroup A and A. duranensis. A total of 629 genes were affected by gene conversion, with 58.7% B converted to A and 41.3% A converted to B. There are many reversals and recombinations between the A and B subgroups, and at least 6 well-defined A or B subgenome exchanges or replacements were identified, including the 10Mb translocation between chromosomes 3 and 13.
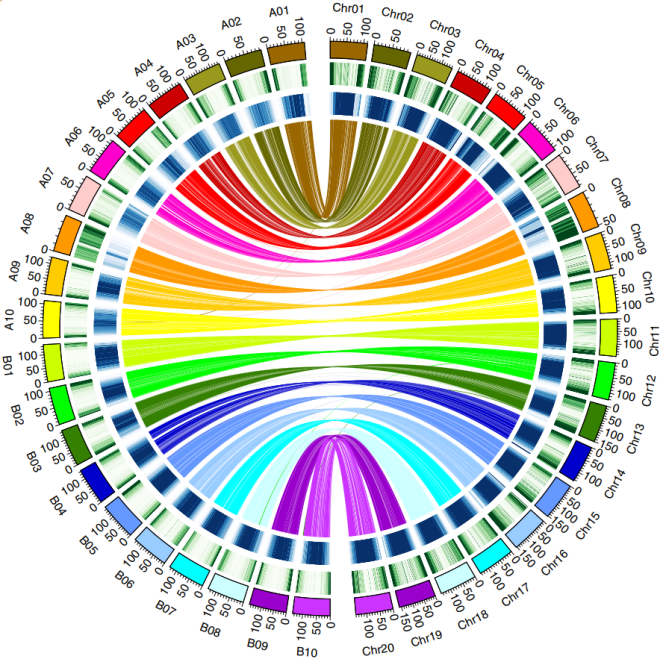
Figure 1 The collinear relationship between the gene density and repeat sequence of the peanut subgenome and the diploid A and B genome
The base substitution rate was calculated by comparing the LTR sequences at both ends of the complete LTR inverted transposon. The A subgenome experienced rapid LTR amplification after tetraploidization (about 250,000 years ago), while the B subgenome and Twt diploid LTRs were amplified before tetraploidization. This may be due to the prevalence of dysfunctional expression or the loss of homologous chromosomes in the subgenome of tetraploid peanuts. The authors raise a question here: Is the sequenced diploid wild peanut A. duranensis the ancestor of the A subgenome?
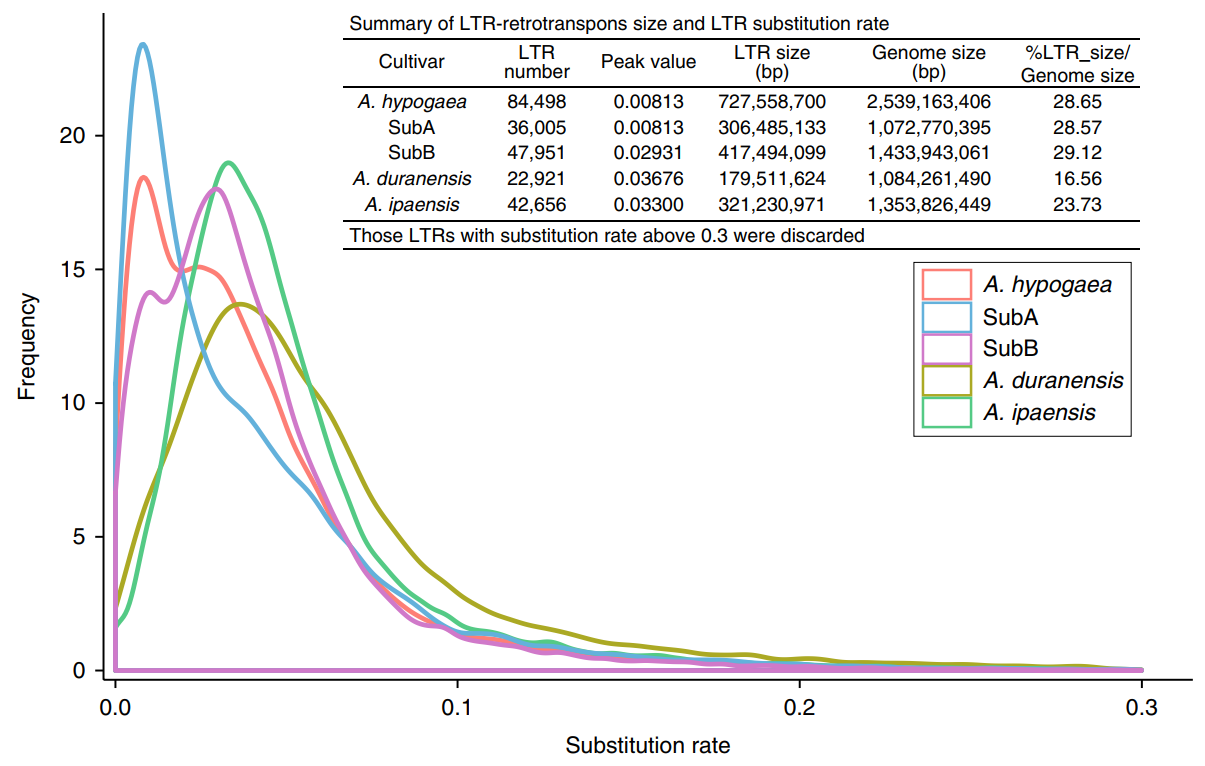
Figure 2 Repeated sequence amplification of sequenced peanut and its diploid ancestors
Legume-common tetraploidy (LCT; about 59 million years ago) and core-eudicot-common hexaploidy,(ECH; about 130 million years ago) have traces retained within the peanut genome. The author reconstructed 16 original legume chromosomes (called Lu) using the common legume genes that retained Post-ECH and post-LCT. This was then compared with existing legume genomes and recorded in a visualization of the karyotype evolution of peanuts and other legumes. Such information allows us to infer the formation process of peanut chromosomes. The peanut ancestor chromosomes A1, A3, A4, A5, A6, and A7 are composed of segments of the Lu chromosomes which have underwent 6 fusions and caused the reduction of the number of chromosomes; The A2, A8, A9, and A10 chromosomes are generated by the cross-exchange of two Lu chromosomes; After genome B was separated from genome A, the cross-exchange within the B genome formed its unique chromosomes 7

Figure 3 Karyotype evolution of peanuts and other legumes
Subgenome content changes
Compared with the diploid peanuts A. duranensis and A. ipaensis, the tetraploid peanut subgenomes A (37,059 genes) and B (46,650 genes) expanded by 0.88% and 12.46%, respectively. Of the 24,380 homologous gene families identified in the diploids of the genomes A and B, 90.68% remain after quadrupleization. There are 114, 28, and 28 auxin response factors (ARF) in the tetraploid peanut, wild A genome, and wild B genome, respectively. These cluster into 9 clusters, of which I-V include only copies of tetraploid peanuts. Moreover, the tetraploid peanut contains 3 copies of the gene CYP78A6 (related to seed growth), while there is only one copy in the diploid B genome. Such differences may be related to the size of the peanut grain. Gene loss also occurs during domestication. For example, tetraploid peanuts have 661 NBS resistance genes, less than the sum of A. duranensis (385) and A.ipaensis (428), indicating the reduction of disease resistance genes in tetraploid peanuts. The authors also constructed a phylogenetic tree of acyl-lipid metabolism networks and symbiotic (SYM) signaling pathway genes at the peanut genome level to provide support for peanut quality improvement and nitrogen fixation research.

Figure 4 The auxin-responsive transcription factor (ARF) family evolution tree and fatty acid metabolism, nitrogen symbiosis pathway, and disease resistance gene chromosome distribution
The origin and domestication of peanuts
In order to study the origin and domestication of peanuts, the authors constructed phylogenetic trees of 52 samples (30 different ecotype heterotetraploid peanuts, 18 wild species, 4 synthetic tetraploids) (Figure 5b). Phylogenetic trees and sequencing data indicate that wild-type tetraploid A. monticola has formed subsp. hypogaea and fastigiata ecotypes. This indicates that peanuts may have originated from different subsp. hypogaea and have been domesticated independently in different locations, such as the evolution of the ecotype adapted to arid conditions in northwestern Peru (Figure 5d, arrow B), and the spread of the Valencia and Spain ecotypes, generated by independent domestication, from southeast Peru to the entire world (Figure 5d, arrows C and D). This is different from the previous prediction of peanuts domesticated by A. monticola in northern Argentina.

Figure 5 Evolutionary history of peanuts
Of the four synthetic tetraploids, ISATGR 278 and ISATGR 5 had a genome-wide doubling, while the other two A genomes were 1.23 and 5.93 times that of the B genome. This may because the incompatibility of the parental chromosomes causes them to not be randomly retained in the offspring, which further supports the author’s hypothesis: there is another A genome donor that is more compatible with the B genome, rather than A. duranensis.
Effect on improvement of peanut traits
The genome revealed many candidate genes for important agronomic traits of peanuts that have been genetically mapped. The single dominant gene that controls the red seed coat is located in a 0.905cM interval on chromosome 3, including WRKYs, MYB and bHLH families, cytochrome P450 and other genes also related to anthocyanin synthesis. The up-regulated expression of these genes may be the cause of the formation of a red seed coat. Peanut seed size is an important yield indicator. The author used a recombinant inbred line population combined with BSA analysis to locate two identical candidate segments on the chromosomes chr07 and chr12, containing 99 and 97 candidate genes, respectively.

Figure 6 Candidate genes for seed size, color and leaf disease resistance
Peanut leaf rust and late leaf spot (LLS) were co-localized in the same genomic region. The resistance and susceptibility pools of the recombined inbred population showed overlapping regions on the Chr13 chromosome. Further analysis showed that the conserved Tir-NBS-LRR gene AH13G54010.1 in this segment may be a disease resistance gene for two diseases. Mutant lines with an oil content of up to 80% were obtained from materials with an oil content of approximately 40%, and re-sequencing combined with tetraploid assembly genomes explained that the high oil content was caused by both ahFAD2A and ahFAD2B mutations.
References:
Zhuang WJ, Chen H, Yang M, et al., The genome of cultivated peanut provides insight into legume karyotypes, polyploid evolution and crop domestication. Nature Genetics. 2019.
https://doi.org/10.1038/s41588-019-0402-2


